
2009 May 8 / |j|d|a|v|i|s|@|c|a|r|l|e|t|o|n|.|e|d|u
Carleton College CS 201, Prof. Joshua R. Davis
As you probably know, many of the images that you see daily are produced by computer software. For example, photographs are often processed by programs such as Adobe's Photoshop or the GNU Project's GIMP. With these programs the user can increase or decrease contrast, hide blemishes on a supermodel's face, or paste alligators where they shouldn't be.
The user can also perform color correction — meaning, adjust the amounts of various colors in the image, to correct for bad photographic conditions, make one part of the image "pop", etc. For the purpose of color correction, it is helpful (for both the user and the program itself) to generate a histogram that shows the spread of colors used in the image. For example, here is a picture of a well-known Northfield-area miscreant.
Shown below are the color histograms for this image. To understand them, recall from earlier in our course that a color is specified by the amounts of red, green, and blue it contains. The Bopa library uses a scale of 0.0 to 1.0 to measure each channel (red, green, or blue); for example, (1.0, 0.0, 0.0) is bright red. The Python Imaging Library, which we'll use in this assignment, measures each channel on an integer scale from 0 to 255; for example, (255, 0, 0) is bright red. In the histograms below, the horizontal axis runs from 0 to 255, and the height of the bar at a given place on the horizontal axis indicates how many pixels in the image have that particular channel value. Here are some miscellaneous remarks, to get you acquainted with reading these histograms.
In this assignment, you will write a program that reads an image file and uses dictionaries to draw the image's color histograms. You are required to work alone. Your work is due Sunday 11:59 PM.
You'll need several files.
histograms.py is the file you'll be editing. It already contains some code.
binarytree.py, binarysearchtree.py, and dictionarybst.py are our usual data structures from class.
bopa.py is our usual Bopa graphics library.
redbit.jpg, greenbit.jpg, and bluebit.jpg are simple images to help you test your program.
jdavis2008.jpg is the image above, taken from the Northfield police database. jdavis2008forehead.jpg, jdavis2008shirt.jpg, and jdavis2008wall.jpg are details from it, that you can use to test your understanding of color histograms.
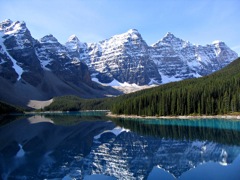
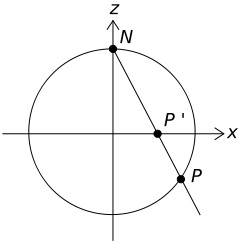
banff.jpg is another photograph with a rather different color distribution. stereographic.jpg is a black-and-white line drawing, with an extremely different color distribution. Feel free to use your own images, too. If you have any interesting ones that you'd like to share with the class, then let me know.
Before we get to the histograms themselves we must build some infrastructure. The Dictionary class provided in dictionarybst.py is pretty nice, but it lacks one convenient feature: enumeration. Enumeration is the process of listing all of the key-value pairs in the dictionary in order (by key). It is implemented through two basic methods: getFirstPair(), which returns the first key-value pair in the dictionary, and getNextPair(key), which returns the next key-value pair after the one containing key.
The file histograms.py contains the skeleton of EnumerableBinarySearchTree, which is to be a subclass of BinarySearchTree. Implement the two enumeration methods. Remember that it is bad form to access the members of another class, or of a superclass, directly. For example, to get the left child use self.getLeftChild(), not self.leftChild. Also, you should not alter BinarySearchTree itself.
The file histograms.py also contains the skeleton of ColorDictionary, which will be a subclass of Dictionary customized to the needs of this particular assignment. Implement its enumeration methods. Warning: You will have to override __init__(). To understand why, carefully study Dictionary.__init__()'s documentation.
Once you have implemented enumeration in the dictionary, test it. For example, the following code should print all of the key-value pairs ordered by key.
mydict = ColorDictionary()
mydict[13] = 'jan'
mydict[17] = 'jane'
mydict[23] = 'juan'
mydict[14] = 'john'
mydict[20] = 'ian'
mydict[28] = 'joan'
mydict[19] = 'johann'
(key, value) = mydict.getFirstPair()
while key != None:
    print key, value
    (key, value) = mydict.getNextPair(key)
You'll add more methods to ColorDictionary later in the assignment.
In this course, our early assignments provided step-by-step instructions for assembling the various parts of the program. Now that we have some more experience, you are expected to carry out more of this high-level planning yourself. So the rest of the code is up to you, subject to these requirements/suggestions.
main() to loop through every pixel in the image and extract its red, green, and blue components. You'll want to have a ColorDictionary that records how many pixels of each red value you have seen; for example, a key-value pair of (114, 26) would indicate that you have seen 26 pixels with red value 114. If you think it is useful, add methods to (or override methods in) ColorDictionary to facilitate this pixel-processing. Similarly, use two other dictionaries to keep track of green and blue values. Once you have processed all of the pixels, use enumeration and Bopa to draw the histograms from the dictionaries.
ColorDictionary data structure to have a method such as getMaximumValue(). Implement it without altering EnumerableBinarySearchTree or violating is members; just change ColorDictionary.
By Sunday at 11:59 PM, submit your file histograms.py electronically, either using hsp or by putting them on COURSES manually. Your work will be graded based on these criteria: